Foreword:
Today, more and more researchers are investing in the use of three-dimensional (3D) organ cultures as tissue biology and cancer models. The development of high-throughput detection techniques that can quantify phenotypic changes in 3D models is a hot topic of current research. The aim of the study was to develop high-throughput high-content imaging and analysis methods that can be used to detect and analyze changes in the morphological features of human cancer cell spheres after compound treatment. We optimized the cell culture protocol for low-adhering U-bottom plates or solid media for three common cancer cell lines, improved workflow, and developed a one-step staining method that reduced variability. We use confocal imaging to capture multi-layered images of 3D matrices and objects, effectively achieving a comparison between different cell phenotypes. 2D and 3D image analysis methods are used to provide multi-parametric characterization of single cell and cell sphere phenotypes. We report some results data, including characterization of numbers, sizes, shapes, and organoids, total or specific number of labeled cells, and determination of cell viability and apoptosis. We obtained a series of confirmed anticancer drugs and cytotoxic drugs with different readings and IC50 values ​​to elucidate the concentration response effect. The method we recommend can improve the performance and throughput of high-content detection methods for compound screening and anticancer drug evaluation using 3D cell models.
purpose:
The research aims to optimize workflows, develop new imaging and analytical methods, and screen compounds by multiple phenotypic assessments of human 3D models.
Materials and Methods:
ImageXpress®MicroConfocal High Content Imaging System
Bandwidth field and confocal (60μm pinhole) light path • MetaXpress® 6 high content imaging software
Test development:
Cells - HCT116 Human Colon Cancer, DU145 Human Prostate Cancer or HepG2 Liver Cancer (ATCC)
Microplate – 96 or 384-well Corning U-type black bottom plate (Corning 4520 and 3830)
Hoechst 33342, Calcein AM, Ethidium Homodimer-1, CellEvent-Caspase 3/7,MitoTracker Orange CMTMRos (Life Technologies/Thermo Fisher)
Cell ball formation :
We use 2 different detection formats:
1. In a low adhesion U-shaped black bottom plate (1000 cells/well), only a single cell sphere is formed per well. The use of these well plates removes the step of transferring the cell spheres and allows them to be formed at the center of the well, facilitating imaging of the entire cell sphere at 10x or 20x.
2. Multiple cell spheres were grown in solid medium (without GFMatrigel matrix). 400 cells were seeded in 1â„2 well 96-well plates.
dyeing:
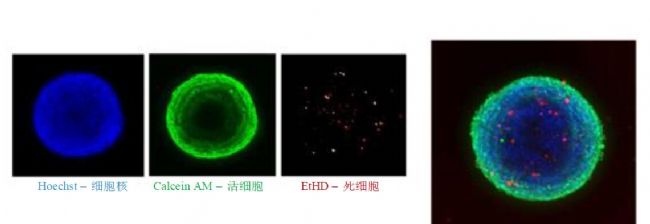
The addition of a one-step dye mixture avoids the process of cell fixation and repeated washing. Calcein AM was used to determine cells with cellulogenic activity, cell viability, and various morphological parameters. Hoechst was used to determine total cell number and nuclear shape. EthD-1 selectively enters cells damaged by outer cell membranes to determine dead and necrotic cells. Dye concentration: Hoechst 15 μM, EthD-1 3 μM and calcein AM 1 μM. Hoechst, calcein AM and EthD-1 images were selected for DAPI, FITC and Texas Red channel acquisition, respectively. Another protocol was 4% paraformaldehyde-fixed cells, 0.02% saponin increased cell membrane permeability, and Hoechst and phalloidin-linked AF488 stained.
Results: Phenotypic analysis using 2D projection
Imaging:
Obtaining only one image with a fixed offset is not enough to compare cell spheres of different sizes or shapes, so it is necessary to acquire images from multiple focal planes. Cell spheres were stained with Hoechst dye in the imaging protocol. A series of images are acquired on different focal planes along the focal axis (Z-stack) and the classic maximum projected image is synthesized.
Multi-parameter acquisition and IC 50 values :
Higher resolution cell sphere imaging allows for more accurate counting and classification of individual cells. We calculated the total number of cells in the image, the number of calcein AM positive cells, the number of EthD-1 negative cells (live cells) and the number of EthD-1 positive cells (dead cells), as well as the average area and fluorescence intensity of different labeled cells. The MetaXpress User Defined Module allows multi-parameter image analysis to quantify different biological results. The performance of the cell pellet assay is described using a compound that represents a batch of different grades of anticancer drug.
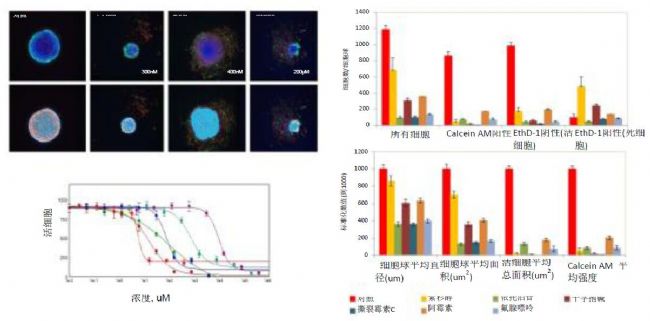
Figure 1. Maximum projected image of a cell sphere representing various phenotypes. Image analysis data for nuclear count and cell sorting results: histogram: control (0.1% DMSO), paclitaxel 150 nM, etoposide 200 μM, staurosporine 300 nM, mitomycin C1 μM, doxorubicin 1 μM and fluoroadenine 100 μM. Geometry or mean intensity values ​​were normalized to DMSO control (set to 1000). Concentration-dependent and 4-parameter curve fitting of selected compounds. Red-paclitaxel, deep red-crosporine, blue-doxorubicin, green-mitomycin C, cyan-etoposide and purple-fluoroadenine.
Solid cell multi-cell ball analysis:
Cell sphere imaging and analysis in semi-solid media was performed in the same manner. Select the image in the confocal mode to capture the images at 5-10 um intervals along the Z axis, and then do the maximum projection analysis. The user-defined module performs single-cell ball counting and characterization, as well as counting the number of live and dead cells in the cell sphere. Compound treatment resulted in a decrease in the number and size of clones, as well as a decrease in the number of viable cells and the total number of cells.
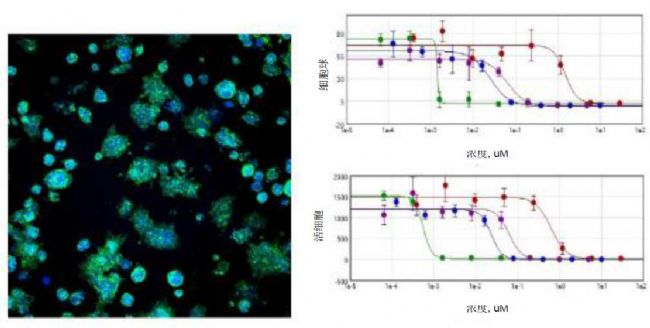
Figure 2. Maximum projected image of cell spheres stained with Hoechst and phalloidin-AF488 in Matrigel. Image analysis data acquisition of cell classification results generated by the user-defined module. The concentration-dependent effect of the selected compounds and the 4-parameter curve fit. Red-etoposide, green-paclitaxel, blue-crosporine, purple-mitomycin C.
3D feature analysis of cell spheres:
3D analysis can be applied to the association of different Z-plane objects, as well as 3D features and morphological analysis of cell spheres or other objects. Cellular object analysis requires accurate calculation of the number of all objects: cell spheres or individual cells, as well as the number of cells in the cell sphere. Multiparametric image analysis is used to quantify different biological data.
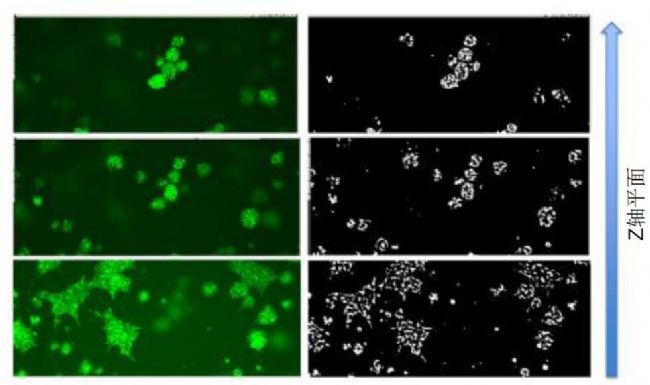
Figure 3. Hoechst and phalloidin-AF488 stained Matrigel in a single cell sphere Z-plane. Note that different focal planes have different objects.

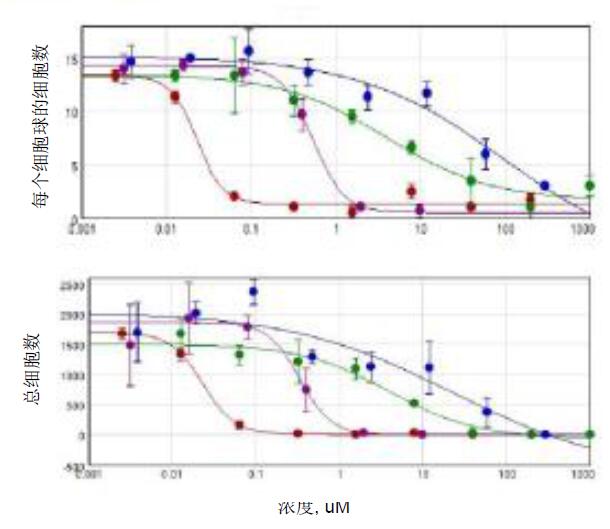
Figure 4. Single cell count for cell ball count and Hoechst staining in Matrigel matrix. Image analysis results obtained by a user-defined module with cell ball object analysis. The concentration-dependent effect of the selected compounds and the 4-parameter curve fit. Red-cytarabine, green-cisplatin, blue-fluoroadenine, purple-doxorubicin.
to sum up:
We have developed a high-throughput quantitative assay using confocal systems and high-content imaging to evaluate viability and morphological changes in 3D cancer cell models.
High-resolution and multiparametric analysis statistically characterize various cell globular phenotypes and drug effects using single cell counting and classification.
2D and 3D analysis can characterize cell spheres and individual cells and provide quantitative test data that can be used to calculate the comparison of IC50s and the potency of various compounds. The effectiveness of this approach has also been demonstrated by screening a panel of anticancer drugs in a 384-well format.
We are a professional Chinese manufacturer of Porcine Extract Powder; we supply various products of Pig Extract Powder, and can providing product images and basic parameters with each Hog Extract and Pig Placenta Extract. We have the perfect after-sales service and technical support. Please do not hesitate to contact us, Look forward to your cooperation!
Pig Skin Collagen Powder,Pig Placenta Extract,Thyroid Porcine Powder,Porcine Pancreas Extract,Porcine Kidney Extract
Xi'an Quanao Biotech Co., Ltd. , https://www.quanaobiotech.com